欢迎访问东莞市长安青华模具实训!
手机网站
|
模具联盟网
|
UG论坛
|
模具人才网
|
模具视频网
专业的模具技术实训
咨询服务热线:
0769-85394529
课程导航
首页
青华简介
青华模具简介
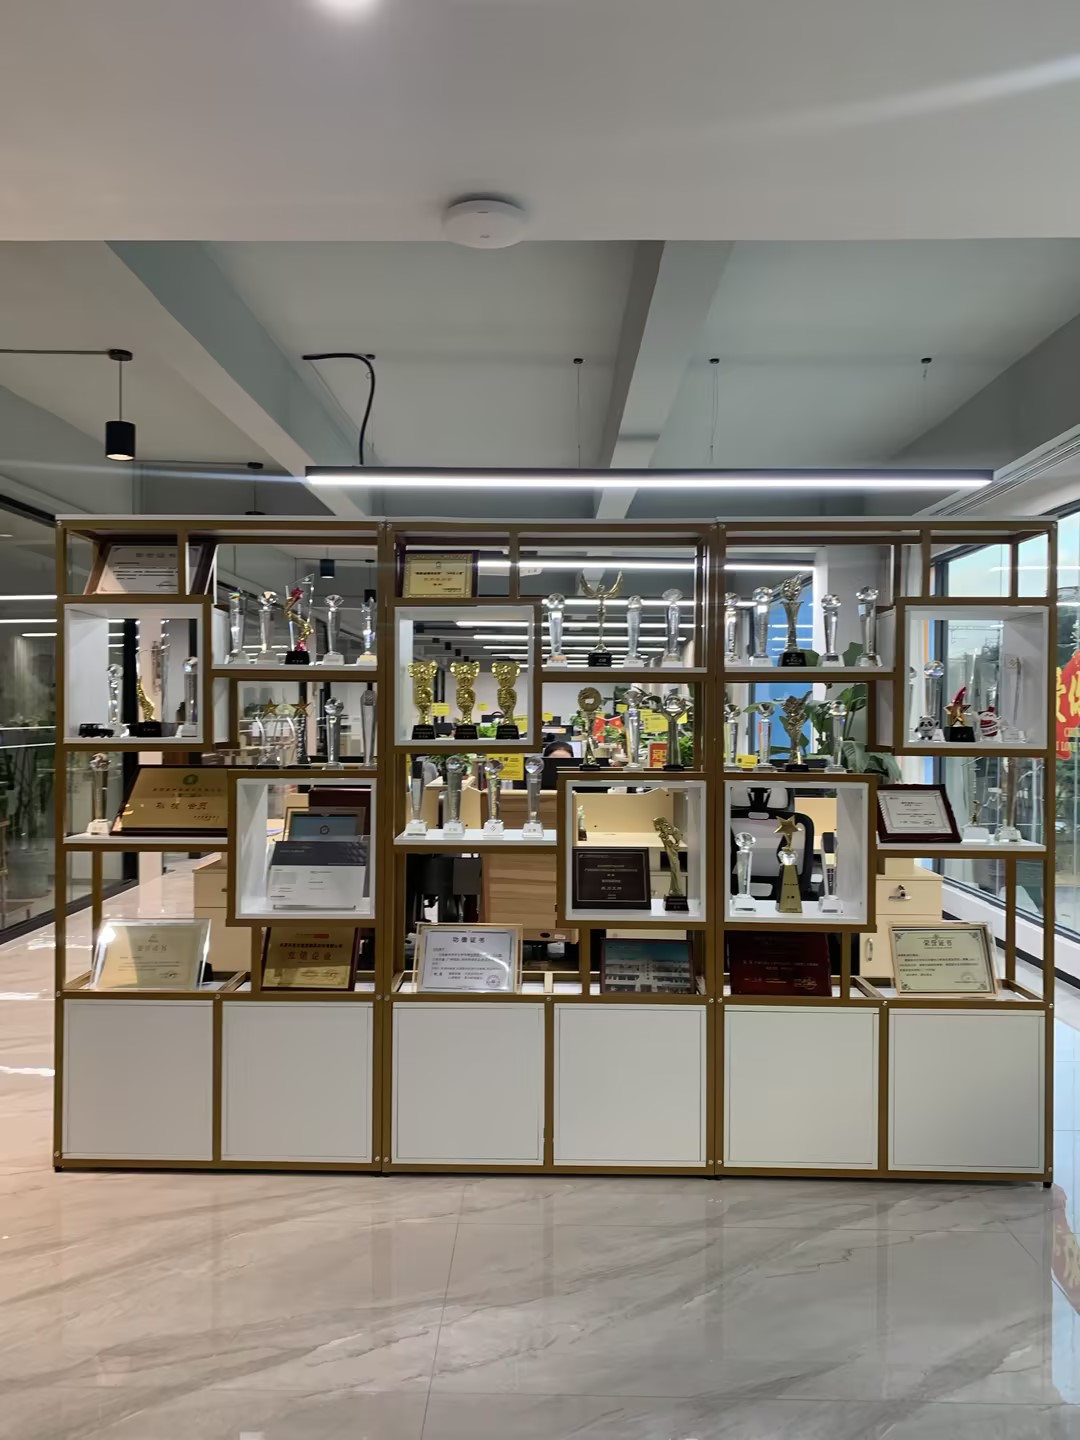
青华荣誉
师资力量
合作企业
高校合作
教学环境
实习场所
报名流程
课程大纲
UG数控编程
塑胶模具设计
UG产品设计
UG产品零件编程
PowerMILL数控编程
五轴数控编程
五金模具设计
产品结构设计
Solidworks机械设计
PLC编程
网络培训
UG数控编程
塑胶模具设计
UG产品设计
PowerMILL数控编程
五金模具设计
五轴数控编程
Pro/e产品设计
模流分析
运动仿真
师资力量
企业培训
内部培训
定向培训
师资力量培训
学员动态
学员就业
学员生活
学员感言
权威认证
培训聚焦
行业新闻
校内新闻
常见问题
就业服务
合作企业
高校合作
企业招聘会
我是学生
技能+经验-机会翻盘-薪水翻倍
我要在职提升
从一技傍身到一技之长-质的飞跃
我要找工作
工作不理想-薪资低-想要高薪职业
我有经验
1-2年新手-想要薪水翻倍
青华模具实训·18年教学经验(2004-2022)
模具培训的黄埔军校
师资团队
40多名专业技术和管理老师
办学经验
18年模具培训行业经验,网络与实地培训学员超过80000人
政府指定
东莞市政府指定模具设计竞赛承办机构
权威认证
中国模具协会指定培训机构,全国模具人才优秀培训机构
高校巡讲
青华讲师团队去过49所高校演讲,为高校带去最新模具技术资讯
就业保障
每月一期模具企业来校现场招聘会,就业率97%以上,平均薪资5000多
实习场所
有自己的大型模具厂,三楼学习,一楼实习
企业培训
为美的、康佳、宇泰塑胶等众多模具企业定制培训计划
认可度高
知名外挂软件(燕秀、机明、星创、进玉等)合作培训机构
配套齐全
生活设施,宿舍(有热水,空调,洗衣机)、饭堂、运动场(篮球、乒乓球)
18
年
18年模具培训行业经验
159
万
159万UG网会员共同认证
12000
家
已经合作超过12000家企业
10
间
10多间多媒体教室上课不排队
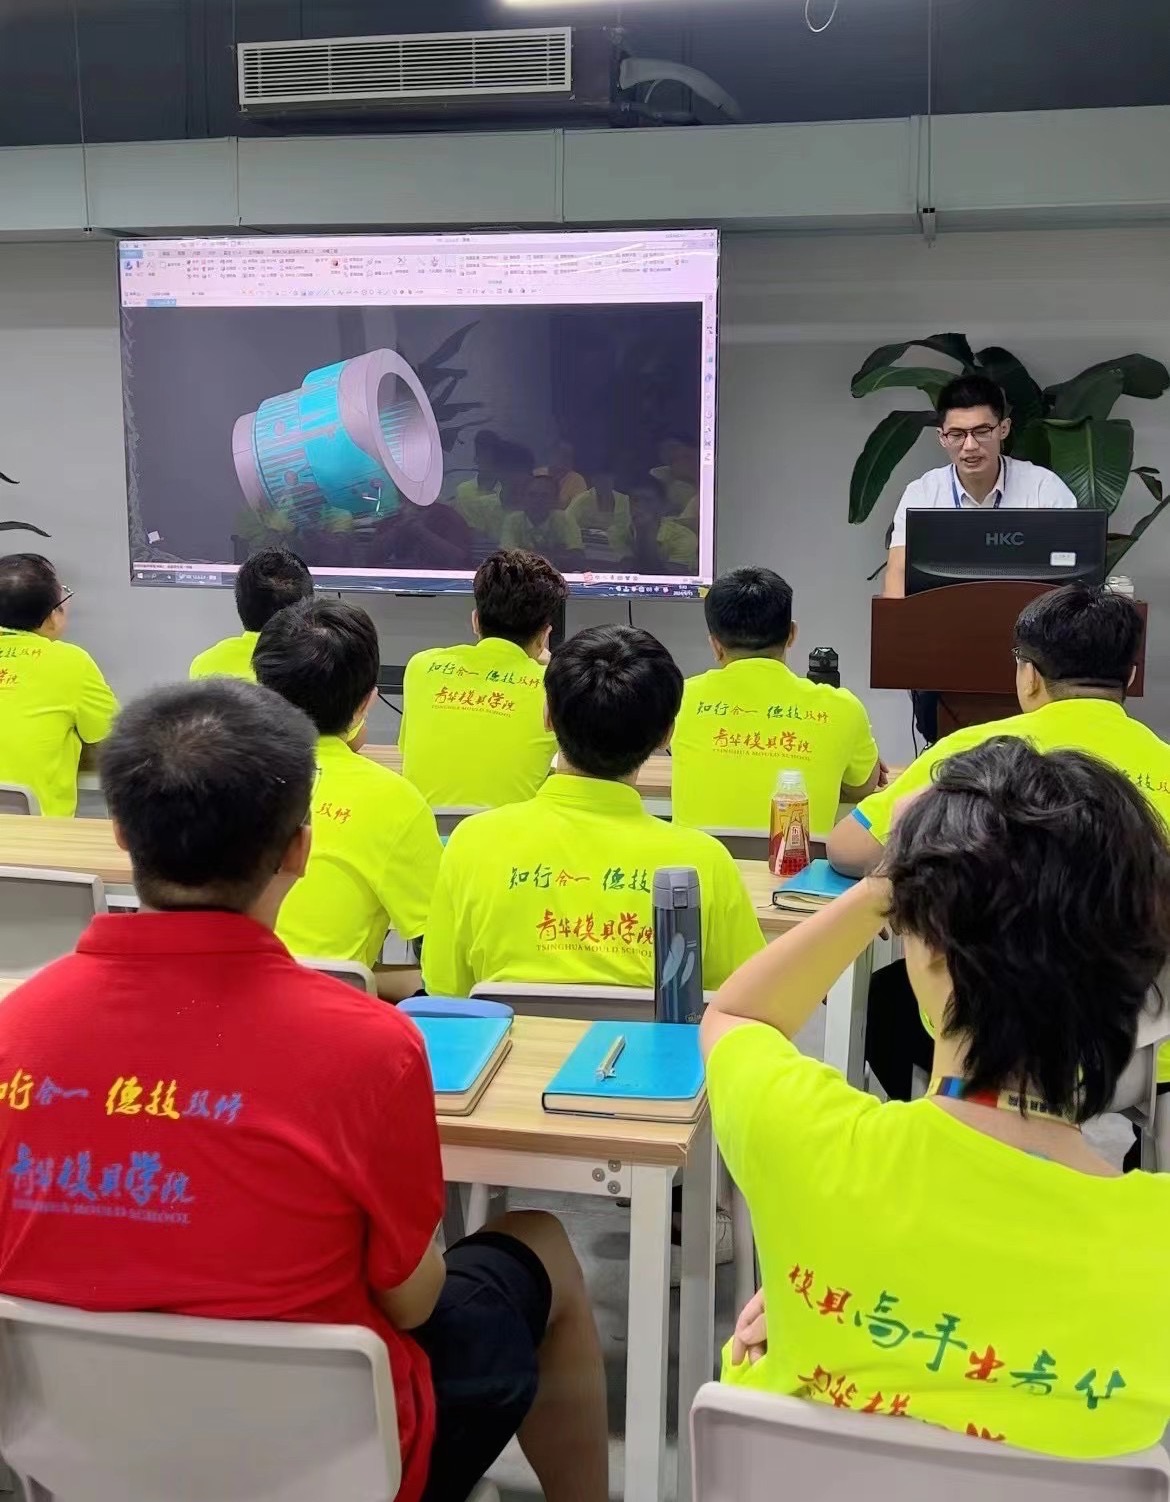
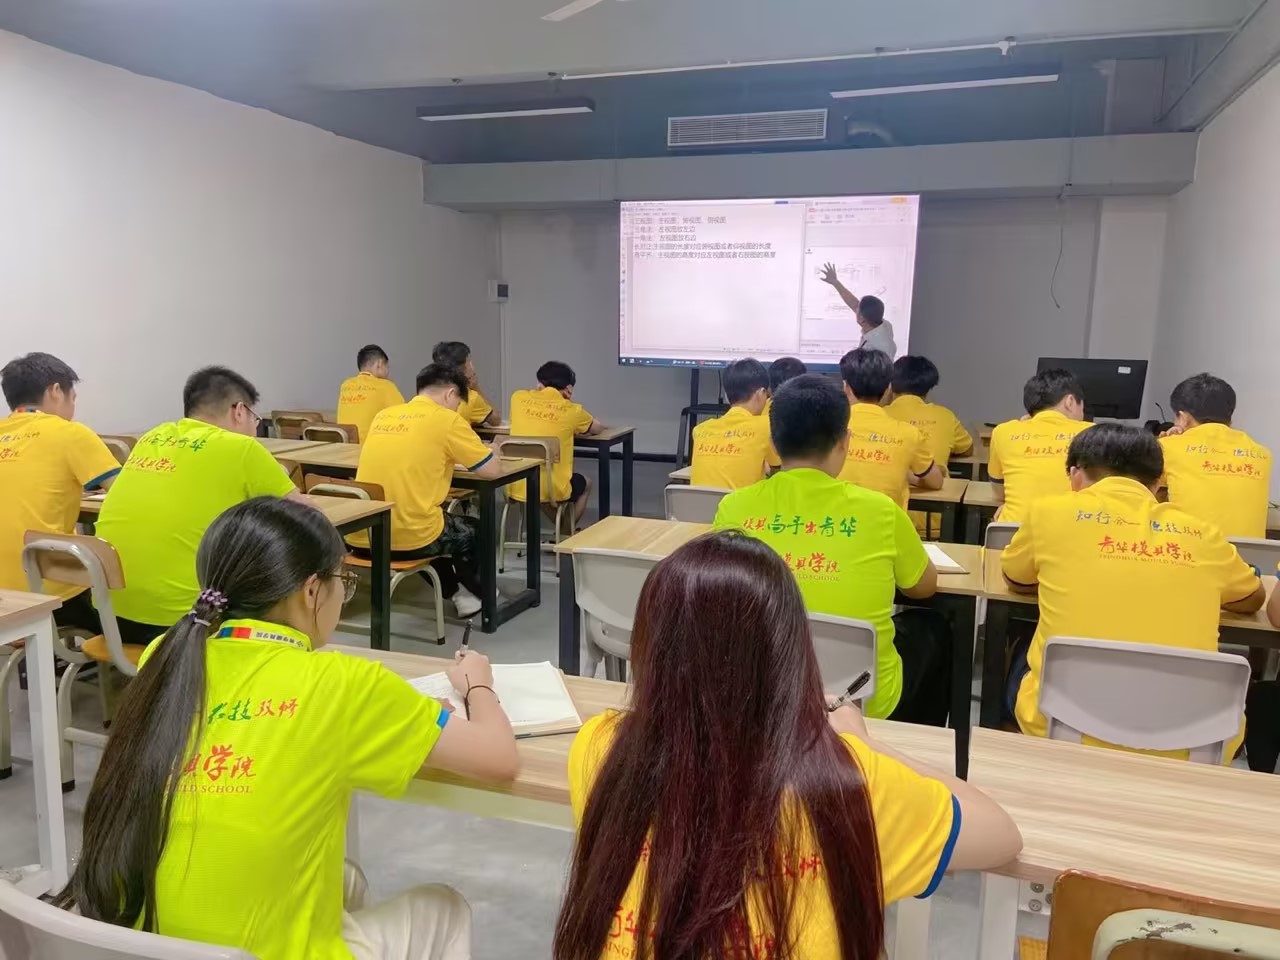
实战讲师汇聚-
实战经验倾囊相授
讲师教授内容严谨、实用,一切以真实提升学员实战能力为导向
UG数控编程
塑胶模具设计
UG产品设计
UG产品零件编程
PowerMILL数控编程
五轴数控编程
五金模具设计
产品结构设计
Solidworks机械设计
PLC编程
CNC操机
陈敏
车铣复合讲师
曾伟
UG模具编程讲师
马琦辉
青华模具教学执行副总
青华模具执行副总 UG数控编程金牌讲师 班长团精英成长营团长 陪伴式教学联合创始人
李嘉操
UG数控编程高级讲师
UG数控编程高级讲师 《模具十万个为什么》杂志主编
肖达
UG数控编程高级讲师
UG数控编程高级讲师
陈惠芬
青华模具学院德育院长
青华模具文化缔造者 青华素质教育创始人 《NX》杂志总编 《模具十万个为什么》杂志总编
黄高笛
青华模具学院教研主任
UG塑胶模具设计金牌讲师 《注塑模具设计实例教程》作者 《NX》杂志技术编辑 《模具十万个为什么》杂志主编
吕培和
UG塑胶模具设计高级讲师
UG塑胶模具设计高级讲师
陈建基
塑胶模具设计讲师
UG塑胶模具设计领域的匠心巨匠
梁嘉琪
UG塑胶模具设计班 班主任
UG塑胶模具设计班 班主任 《班长团精英成长营》助教
孙权
青华模具创始人
青华模具创始人 《NX》杂志社社长 中国模具研究中心创始人 《企业经营智慧》课程创始人 《班长团精英成长营》创始人
何建国
青华模具学院教学院长
青华模具学院教学院长 UG产品设计金牌讲师 《NX》杂志技术编辑 陪伴式教学联合创始人
吴翔
UG产品设计讲师
UG产品设计讲师
王婷
金牌就业专员/产品零件编程班主任
金牌就业专员 就业指导课导师 班长团精英成长营助教
杜昌选
UG产品设计讲师
UG产品设计讲师
马琦辉
青华模具教学执行副总
青华模具执行副总 UG数控编程金牌讲师 班长团精英成长营团长 陪伴式教学联合创始人
李嘉操
UG数控编程高级讲师
UG数控编程高级讲师 《模具十万个为什么》杂志主编
王鹏惠
UG产品编程高级讲师
UG产品编程高级讲师
肖达
UG数控编程高级讲师
UG数控编程高级讲师
谌国凯
UG数控编程高级讲师
UG数控编程高级讲师
陈爽亮
PowerMill编程高级讲师
PowerMill编程高级讲师
孙欢欢
PowerMILL编程班 班主任
《班长团精英成长营》助教
李嘉操
UG数控编程高级讲师
UG数控编程高级讲师 《模具十万个为什么》杂志主编
王鹏惠
UG产品编程高级讲师
UG产品编程高级讲师
刘月霞
UG五轴编程班 班主任
UG五轴编程班 班主任, 《班长团精英成长营》助教
汪海
五金模具设计讲师
五金模具设计讲师
梁娟蓉
五金模具设计班主任
五金模具设计 班主任 班长团精英成长营助教
孙权
青华模具创始人
青华模具创始人 《NX》杂志社社长 中国模具研究中心创始人 《企业经营智慧》课程创始人 《班长团精英成长营》创始人
何建国
青华模具学院教学院长
青华模具学院教学院长 UG产品设计金牌讲师 《NX》杂志技术编辑 陪伴式教学联合创始人
吴翔
UG产品设计讲师
UG产品设计讲师
杜昌选
UG产品设计讲师
UG产品设计讲师
张欢
UG产品设计班 班主任
UG产品设计班 班主任 班长团精英成长营助教
彭仙明
Soliworks机械设计与自动化讲师
机械设计与自动化领域的智慧灯塔与梦想引路人
陈薪儒
人工智能PLC自动化讲师
徐敏
工控实操讲师
李嘉操
UG数控编程高级讲师
UG数控编程高级讲师 《模具十万个为什么》杂志主编
王鹏惠
UG产品编程高级讲师
UG产品编程高级讲师
陈爽亮
PowerMill编程高级讲师
PowerMill编程高级讲师
肖达
UG数控编程高级讲师
UG数控编程高级讲师
黄维
UG数控编程讲师
CNC实训导师 班长团精英成长营领教
青华模具实训-
热门课程
包学会,免费推荐就业,可选择“0”学费学习,工作后分期还钱
UG数控编程
塑胶模具设计
UG产品设计
UG产品零件编程
PowerMILL数控编程
五轴数控编程
五金模具设计
产品结构设计
Solidworks机械设计
PLC编程
CNC操机
UG基础入门课
UG数控编程
UG数控编程作品
UG数控编程作品
UG数控编程作品
申请试听
+
我要报名
+
UG数控编程第一阶段
开始学习
1.机床类型介绍与常用代码讲解
2.刀具、夹具与加工材料的讲解
3.UG加工界面(编程前准备工作、四种视图)
4.UG面铣策略(几何体、工具、刀轴)
UG数控编程第二阶段
开始学习
27.塑胶模具结构讲解
28.电极设计的基本知识介绍
29.QH23前模电极设计前准备工作、分析拆电极位置
30.QH23前模封胶位与胶位电极拆解
UG数控编程第三阶段
开始学习
52.QH26前模背面行位槽与斜抽电极拆解
53.QH26前模正面封胶位与胶位电极拆解
54.QH26后模分型面电极拆解
55.QH26后模胶位电极拆解
塑胶模具设计
UG塑胶模具设计作品
UG塑胶模具设计作品
UG塑胶模具设计作品
申请试听
+
我要报名
+
UG塑胶模具设计第一阶段
开始学习
1.模具理论基础知识
2.产品分模阶段
3.分模的基本原则
4.常用分模的三种思路
UG塑胶模具设计第二阶段
开始学习
18.鼠标底壳产品分析,做DFM报告
19.产品排位,确定模仁大小
20.确定模胚类型及模胚大小,订购模胚
21.注塑机校核
UG塑胶模具设计第三阶段
开始学习
45.汽车仪表盘骨架全3D模具设计
46.UG全3D图档装配及3D出图
47.手机中框全3D模具设计
48.齿轮模模具结构设计
UG产品设计
UG产品设计作品
UG产品设计作品
UG产品设计作品
申请试听
+
我要报名
+
UG产品设计第一阶段
开始学习
1.CAD平面画法
2.CAD构建零件轴侧转换三视图
3.UG从视图的角度构建产品
4.UG从视图的角度构建产品
UG产品设计第二阶段
开始学习
18.逆向点云——档泥板
19.逆向点云——摩托车头盔
20.逆向STL——机壳类产品
21.逆向STL——玩具米奇
UG产品设计第三阶段
开始学习
28.什么是正向设计
29.图片造型—剃须刀
30.图片造型——水笼头手柄
31.HELLO KITTY摄影头建模
毕业学员
就业采访
住在厂里学模具,培训实战零距离
我的人生因为青华得以升华!
世界万物因为阳光和雨露而变得更加生机勃勃;大海上的船只因为有航标所以不至于迷失方向;我的人生因为青华得以升华!不是因为我学的有多好,而是我的内心深处有了一股正能量!
UG编程第08期学员刘子帮培训心得
时间飞逝,对于这几个月的培训课程,我想我只能用受益匪浅这四个字来形容了。老师们的博文广识、生动讲解、精彩案例无不在我的脑海里留下了深刻的印象,我只恨自己才疏学浅、文笔糟糕,不能够将所有的感触都通过文字显然于纸上。但是我还是尽力绞尽脑汁,以祈求能将培训完后心中所想所获能表达出来。
邹猛在青华学习产品设计心得
我是08期产品设计的一名学员,我叫邹猛,来自古城襄阳。去年刚刚从学校毕业,有幸在东莞这边找到一份cnc调机工作。虽然工作一年多了,心态相比刚毕业时安静了很多,但依然没能战胜那颗骚动的心。
青华暑期大学师资培训班王晖老师的学习感言
青华模具学院深耕模具技术培训十年,形成了深厚的技术资料积淀,具有非常丰富、完善、实用性强的技术案例、资料和教学视频,这些资料来自一线、高度总结,来源实际又高于实际,给了我深深的震撼,也使我深深地喜欢上了这里的专业学习。
模具企业
招聘会
一地学习全国推荐就业-机会翻盘-薪水翻倍
复邦复合材料有限公司
东莞复邦复合材料有限公司成立于2008年1月3日,公司位于东莞市谢岗镇赵林金川工业区,外资企业。公司投资总额120万美金,占地面积约1.3万平方米,现在员工近600人,主要生产高端碳纤维自行车配件(车架前叉后叉连接器座管车手把等)
2022-09-29
东莞东裕塑胶制品有限公司
东莞东裕塑胶制品有限公司,2002年02月01日成立,经营范围包括生产和销售塑胶制品、汽车塑胶电子制品、鼠标、玩具、鼓风机及塑胶电子配件(涉证或涉限产品除外)、模具等。
2022-09-29
佛山市三水润成五金制品有限公司
佛山市三水润成五金制品有限公司,1999年03月08日成立,经营范围包括生产、销售:五金制品,塑料制品,皮革制品,锁具制品等。
2022-09-29
广州晋颢体育用品有限公司
广州市晋颢体育用品有限公司是一家汽摩及配件的企业,是经国家相关部门批准注册的企业。
2022-09-29
广东钮铂尔科技有限公司
广东钮铂尔科技有限公司,于2012-12-27在广东省东莞市大朗镇宝陂富民南三路30号注册成立,属于科技推广和应用服务业,主营行业为科技推广和应用服务业
2022-09-29
东莞好景塑胶模具制造有限公司
1986年我公司成立于香港,发展至今,已成为占地面积40000多平方米,拥有员工2000多人、
2022-09-29
东莞市百辉塑胶制品有限公司
东莞市百辉塑胶制品有限公司,于2012-08-15在广东/东莞注册成立,属于制造业,主营行业为制造业,我公司以生产加工的模式经营,加工方式为来料加工
2022-09-29
东莞泓品五金有限公司
东莞泓品五金有限公司主要经营:生产和销售五金制品、五金配件及承接来料加工相关业务。(依法须经批准的项目,经相关部门批准后方可开展经营活动)等产品。
2022-09-29
东莞市声威实业有限公司
声威实业全称声威实业有限公司,是一家大型工程项目的施工承接集团,其所属子公司声威家具,声威装饰, “装修工厂化”
2022-09-29
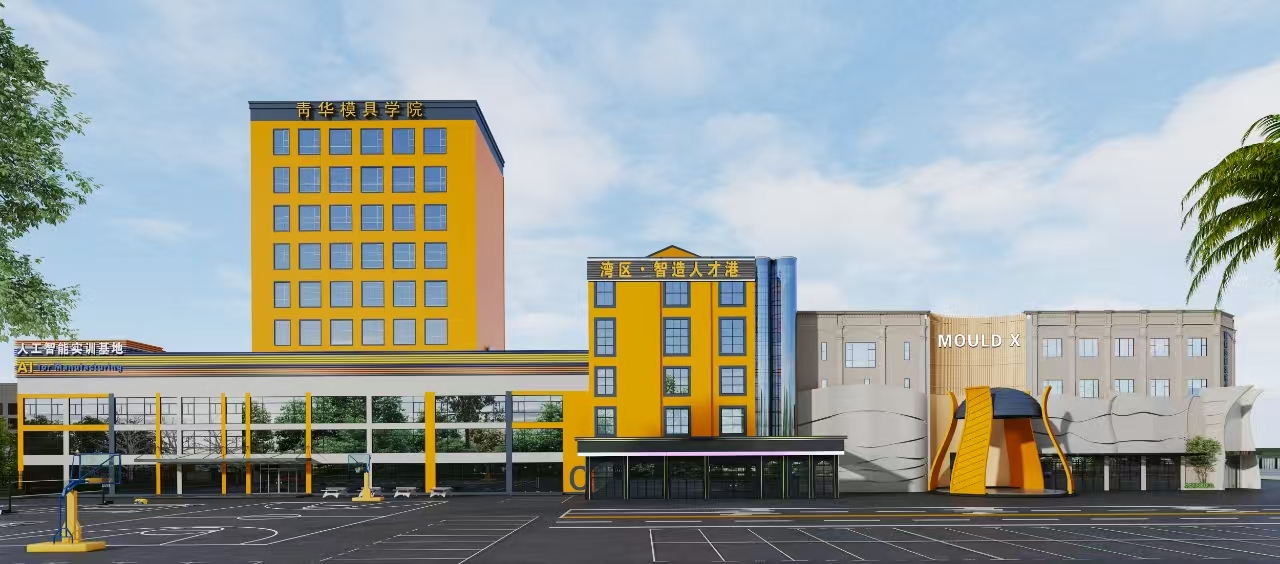
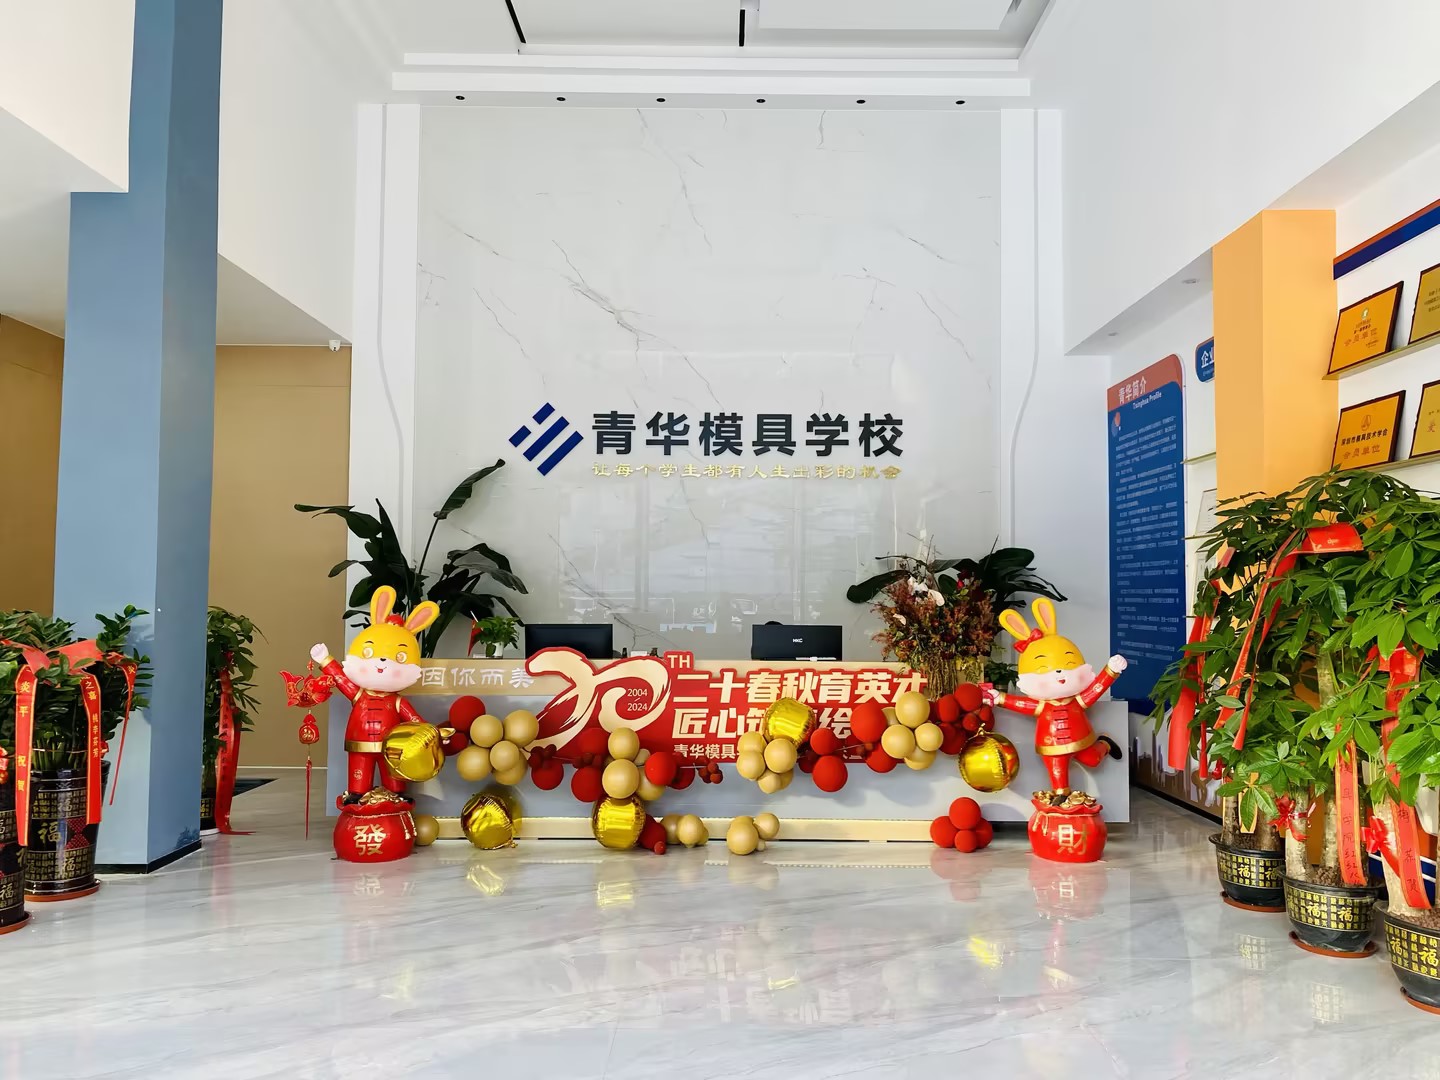
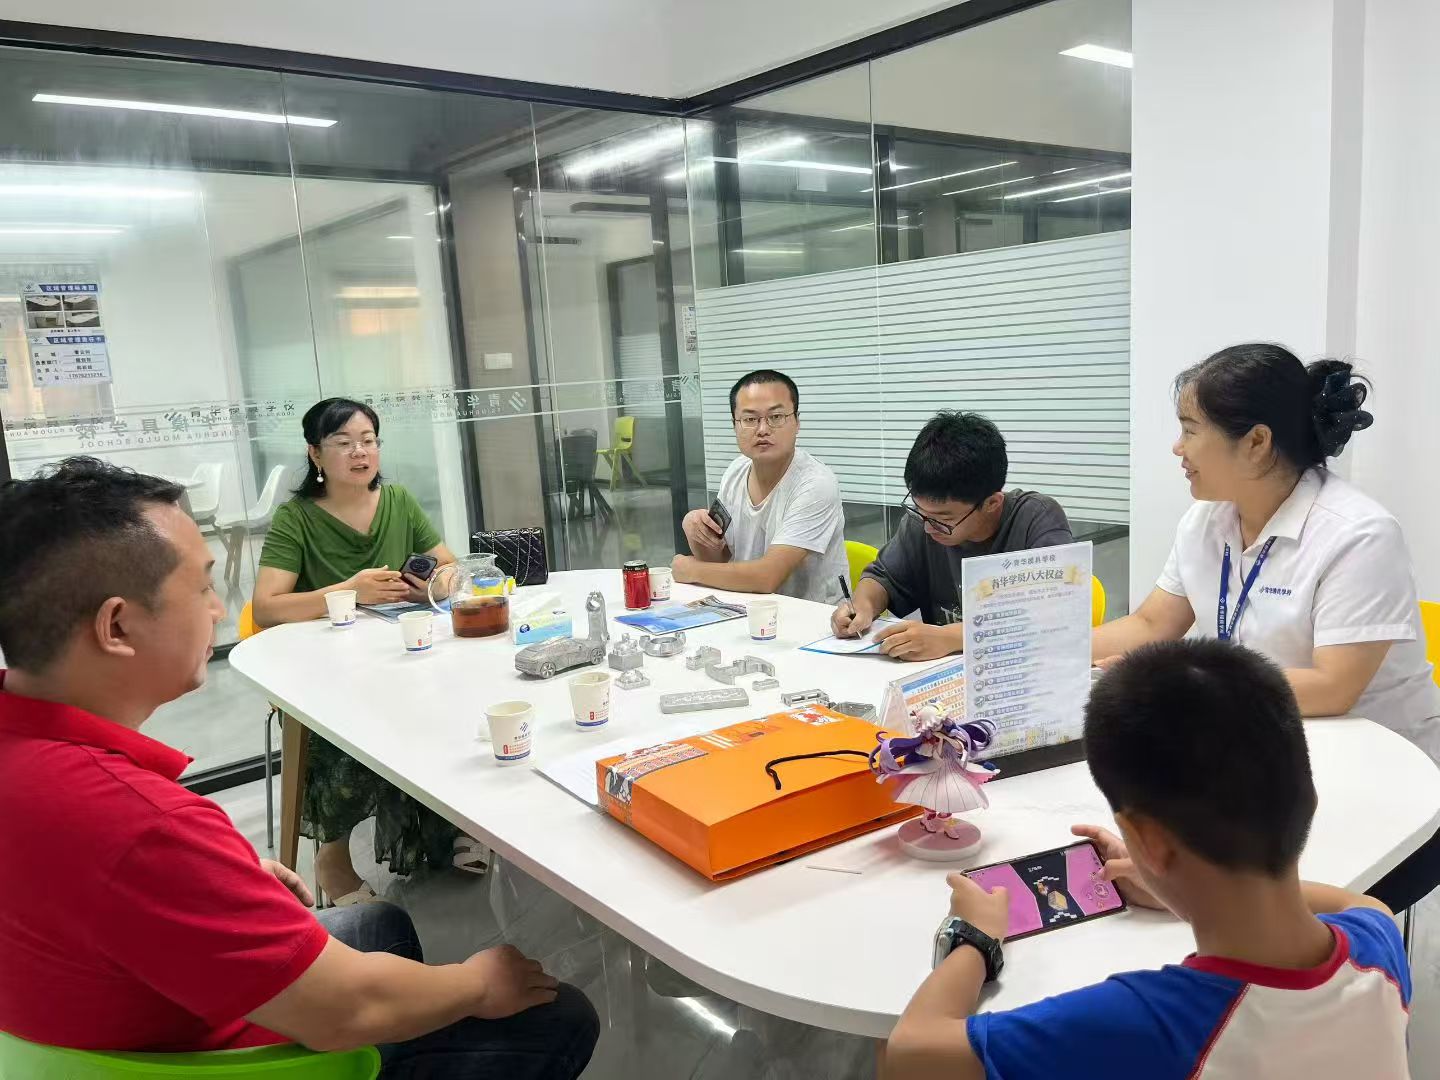
青华模具实训
教学环境
教学优势一目了然,实力有目共睹,专业的模具技术培训学院
学校大门
前台
青华接待室
青华办公室
多功能室
多功能室
聚焦行业
新闻资讯
关注行业动态,了解模具行业发展新动态
行业新闻
more
技以立身 知以致远:技术重塑人生,认知铺就长路
2026-06-14
选对老师,学对技术!青华硬核师资,助力零基础轻松入行
2026-06-10
青华师生应邀参加深圳展会,在行业前沿解锁实战新课堂
2025-11-12
青华模具牵手海克斯康开启职业技能与智能制造融合新篇
2025-03-25
青华模具学院第三届PowerMill工程师级考证圆满结束
2023-09-20
PowerMill工程师等级认证考试火热报名中...
2023-09-11
9月模具人才专场招聘会火热报名中
2023-09-11
西门子原厂UG认证开考啦,火热报名中.....
2023-07-05
PowerMill工程师等级认证考试火热报名中...
2023-05-23
青华班长团精英训练营-幸福人生创造之旅
2022-01-04
校内新闻
more
转行必看|模具为什么是普通人最优长期赛道
2026-07-08
我校正式推进技能考点&高级技能培训基地申报!
2026-07-08
从两班倒操机,到长白班编程,入职1个月直接加薪2000!
2026-07-08
择校避坑,青华模具六大核心办学优势一览
2026-07-08
学一门技术,掌握人生主动权
2026-07-08
学编程为什么首选UG?不教MC、不用Creo?一篇讲透行业真相!
2026-07-08
沉浸式匠人氛围,练出AI替代不了的硬核功底
2026-07-08
毕业不用焦虑,一门硬核技术,治愈所有求职内耗
2026-07-08
AI只会模板,实战经验永远无法复制
2026-07-08
AI能出图,但替代不了工程师的工程判断
2026-07-08
常见问题
more
这个世界正在狠狠奖励那些努力的人——记月考颁奖典礼
2022-01-04
我们的一生,是一段充满冒险与考验的旅程,这段旅程会有惊喜,会有欢乐,当然,也不免交织着苦涩,交织着迷茫。由于无法预测下一步将会发生什么,因此我们都充满了期待。只有懂得在考验中磨练自己,才能体现人生的价值,才会逐步成长
8月份开班-出发,我们的目标是星辰大海
2022-01-04
东莞,一座让无数人眼花缭乱,沉迷于画一般的景色的城市。东莞是广府文化的发祥地之一, 是粤曲的重要发源地之一,也是中国的粤剧之乡。除此之外东莞还是珠三角中心城市之一、粤港澳大湾区城市之一,深圳都市圈城市之一
青华塑胶教育课-有效沟通的技巧
2022-01-04
沟通一直是人类社会的一大课题,良好的沟通可以帮助我们去搭建一个交际平台,以便于我们在工作上获得更多信息,在生活中获得帮助,让周围的环境变成有利于我们生存、让工作更顺利的完成。同样的,沟通不畅也会带来诸多不便,引发争吵、推卸、误会等一系列问题
接到任务无从下手?5W2H分析法让你轻松搞定无压力
2022-01-04
接到一个任务无从下手?看着自己的同事轻而易举完成高难度任务,羡慕却又感叹自己能力不足?相信很多学员都会遇到上述的情况,别担心,掌握5W2H分析法,让你轻松搞定无压力
学习压力大?来场运动会释放激情
2022-01-04
一张一弛,文武之道也。有效果的学习,需要适当的运动来辅助!7月22日青华模具学员运动会于青华篮球场举行!主要阵营为设计队和编程队,两个队伍的实力旗鼓相当,赛局一度非常紧张
友情链接:
友情链接
青华模具实训 Copyright 2021 技术支持:
【网一科技】
【后台管理】
粤ICP备15108561号
【
BMAP
】 【
GMAP
】 【
百度统计
】
立即体验
在线咨询
Online consulting
青华孙老师
青华周老师
青华王老师
青华梁老师
咨询热线
0769-85394529
客服在线

 专业的模具技术实训